In the realm of swarming and collective motion, juvenile locusts provide a striking example. Before they can fly, these insects march along the ground in large groups all moving aligned in a single direction. Each of the following figures shows patterns of vegetation destruction in the wake of these hungry foragers.
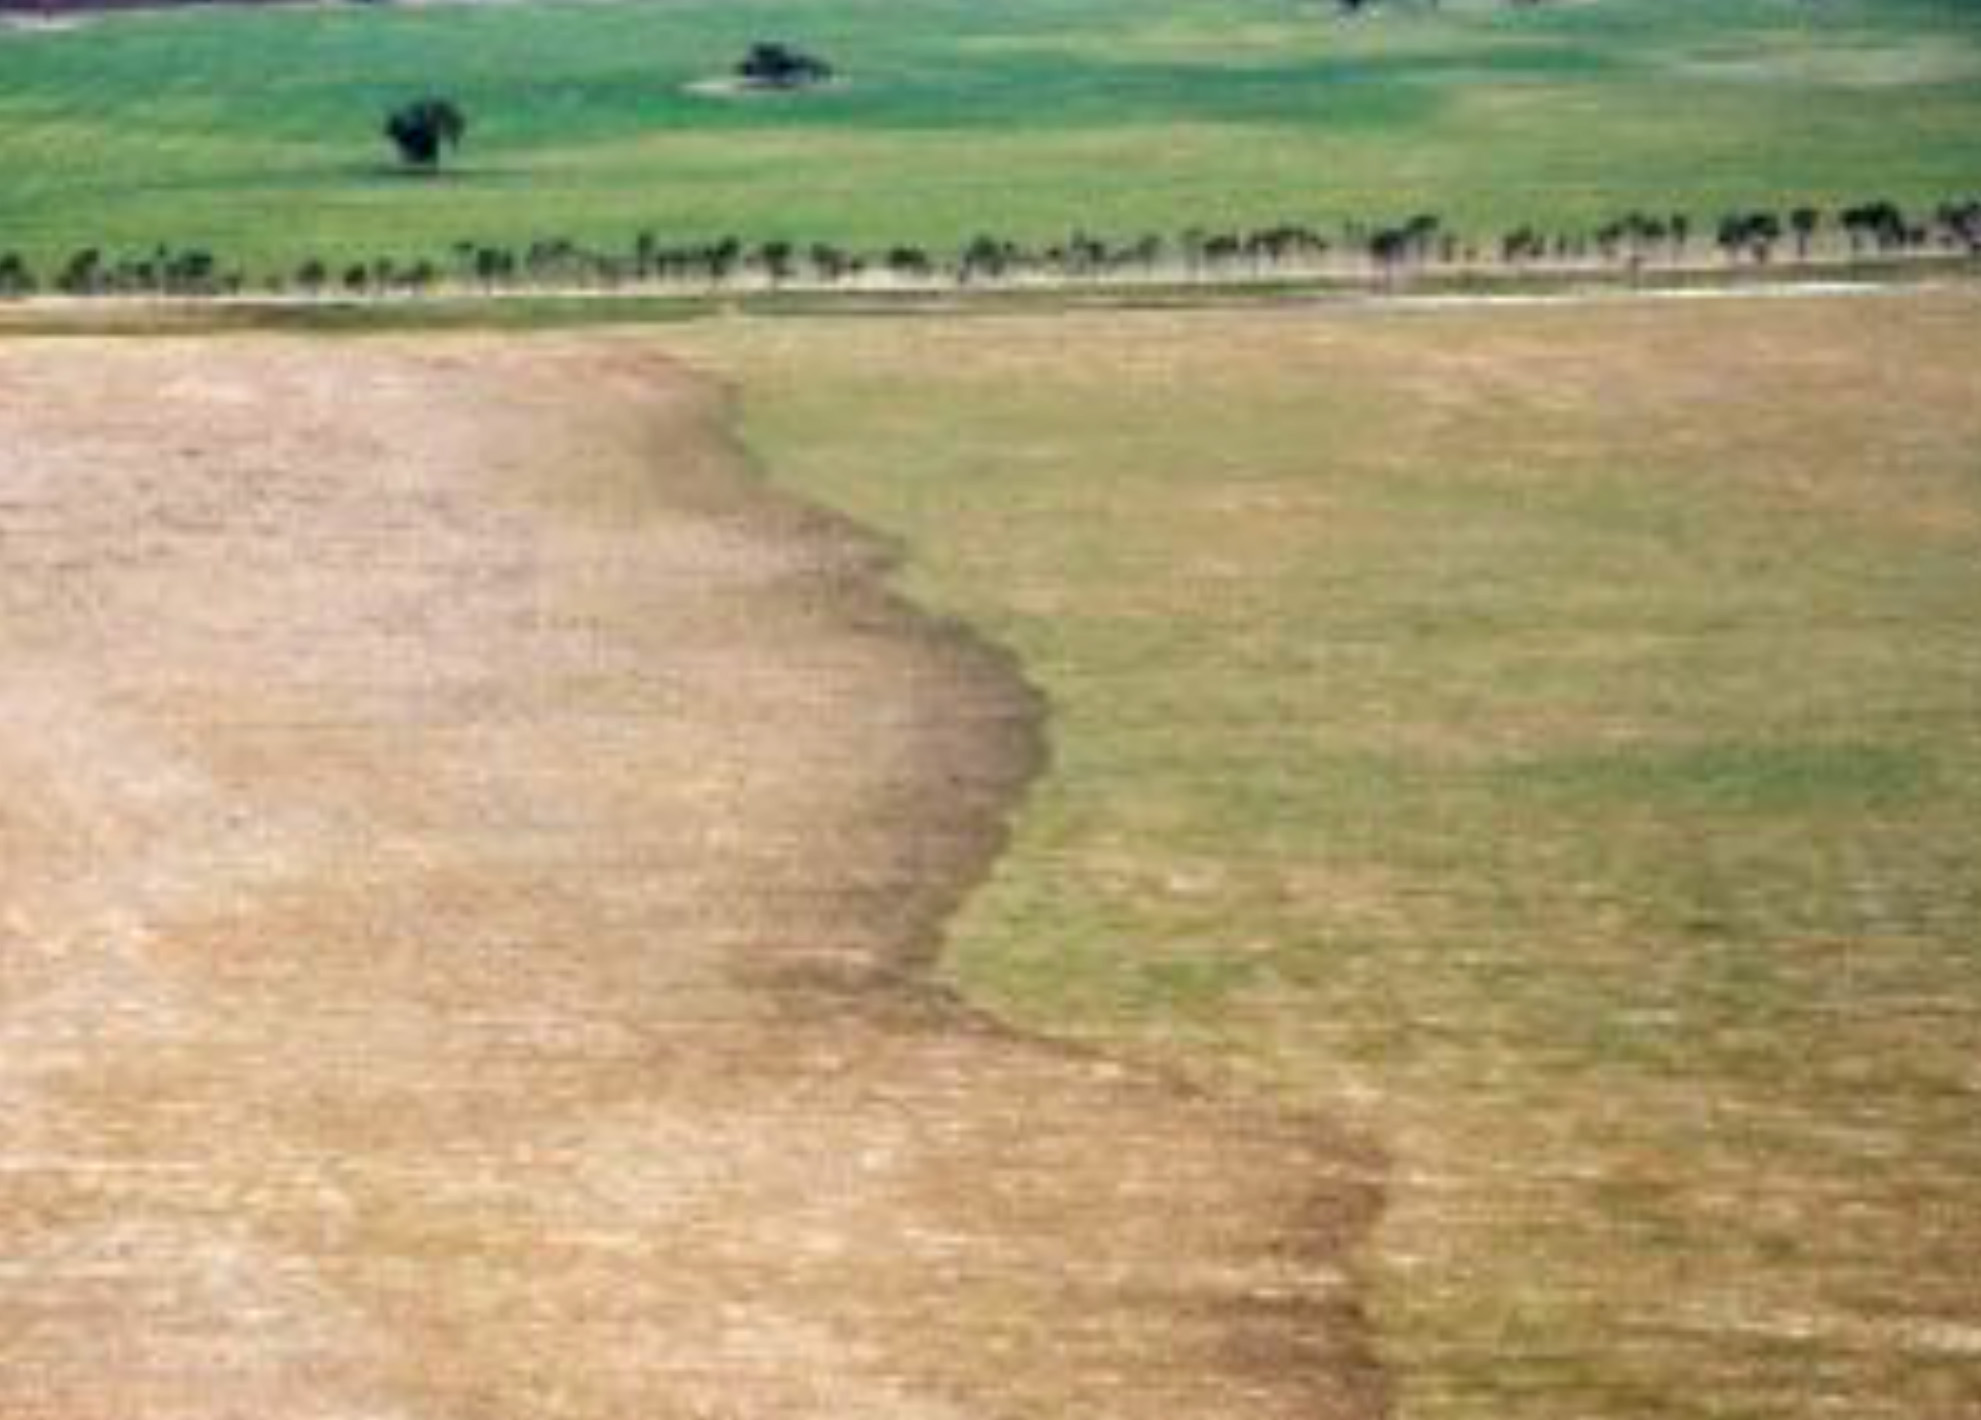
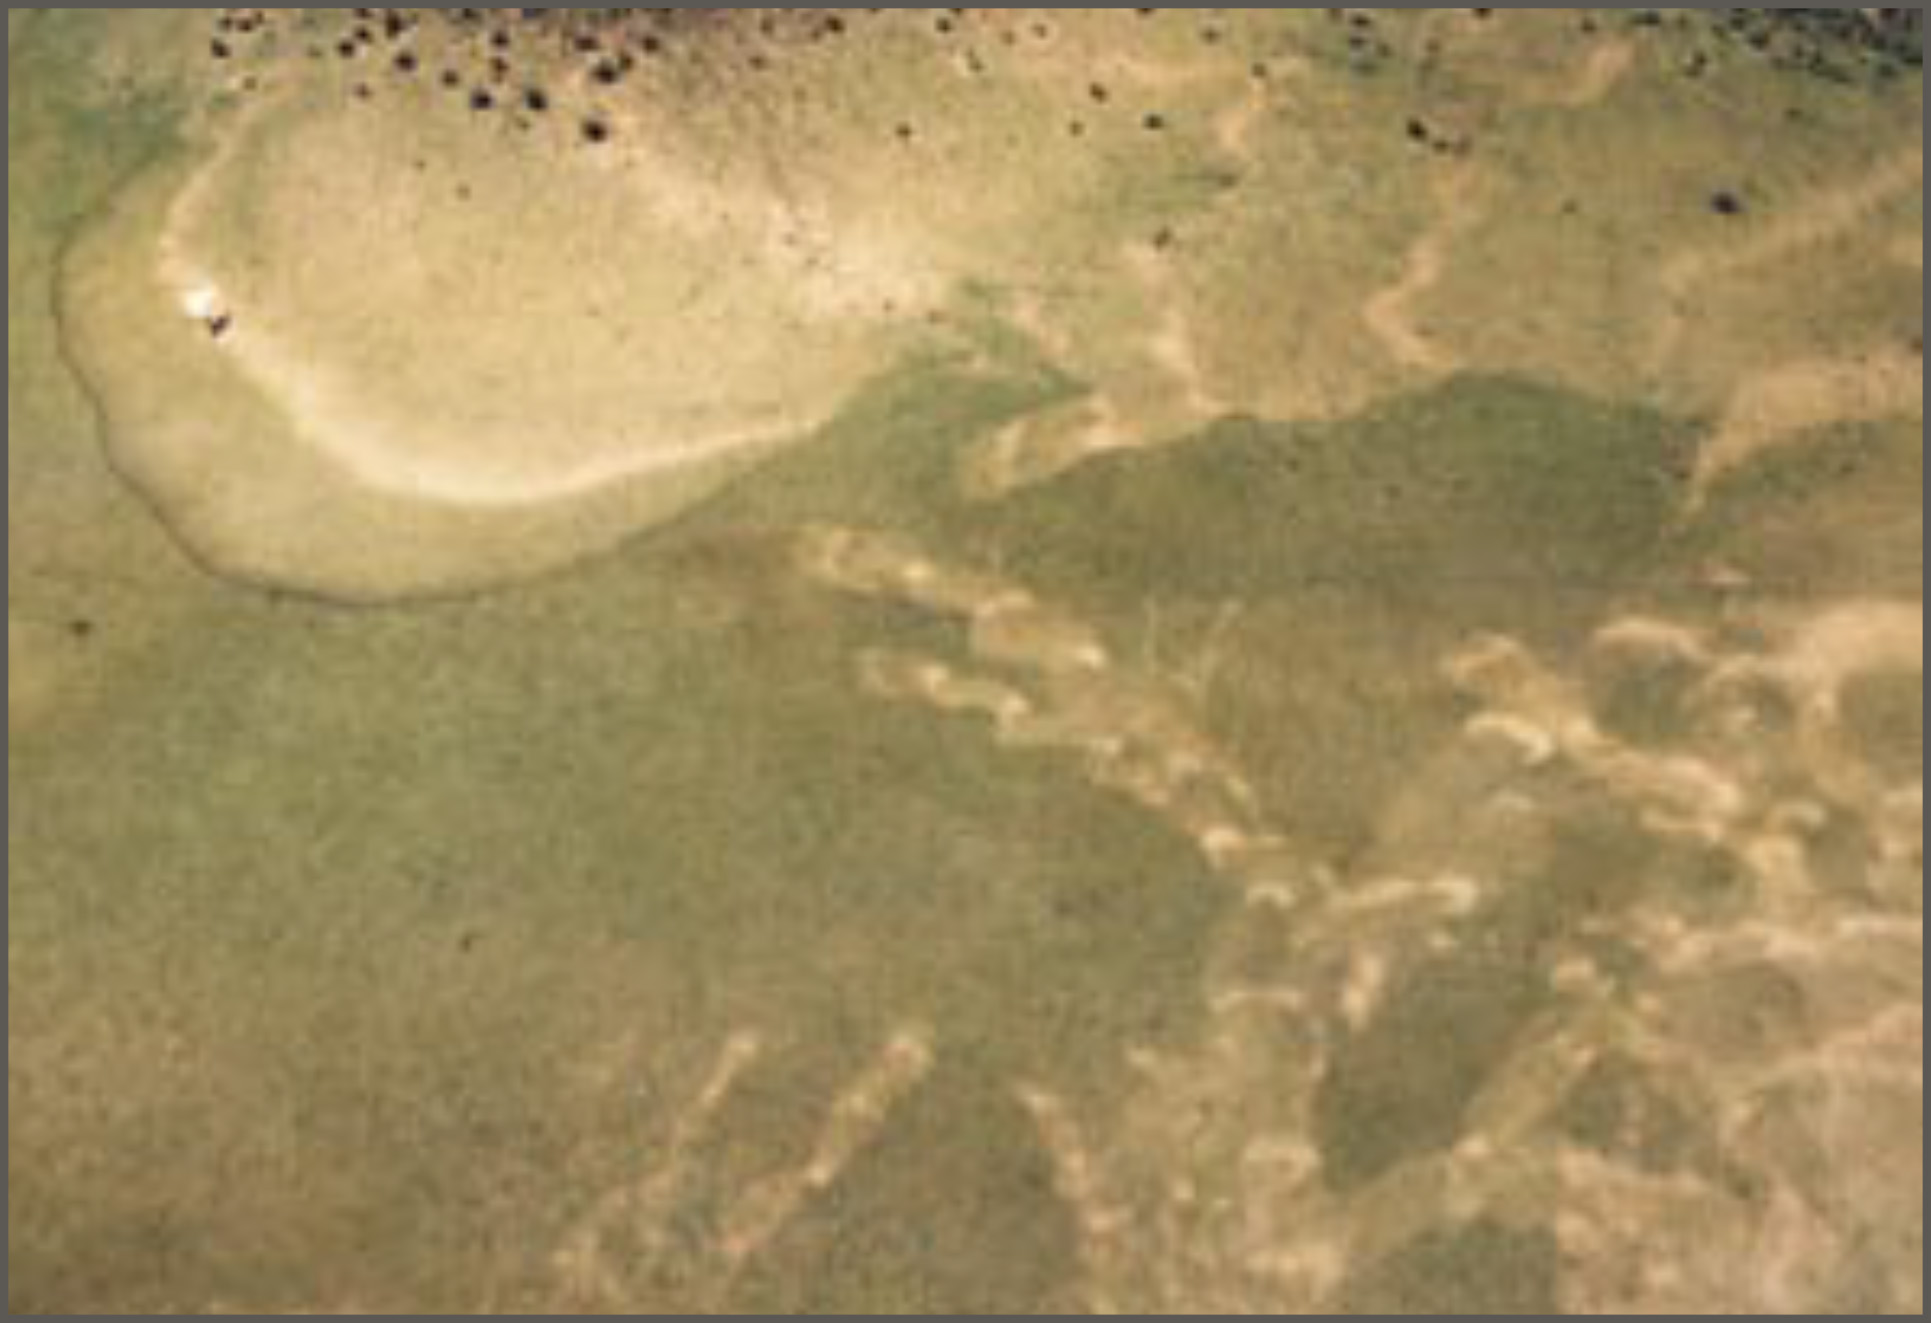
Figure 1. Vegetation is consumed as the swarm forms a front moving from left to right (left panel) [1]. Crops have been destroyed in both smooth fronts and complicated fingers (right panel) [2].
We build large-scale models of locust swarms based on data-driven selection of individual interactions. Many models of individual interaction within a swarm have been suggested throughout the modeling, robotics, and biological communities. For simplicity, we focus on two:
- The simple averaging model, where each locust turns towards the average direction of all of its neighbors within a given radius.
- The nearest neighbor model, where each locust turns towards the heading direction of its nearest neighbor only.
By turning to individual-level trajectory data, we infer ideal parameters for each of these two interaction models. These data were extracted from video of a locust swarm marching in the countryside outside of Hilston, Australia. More details in [3].
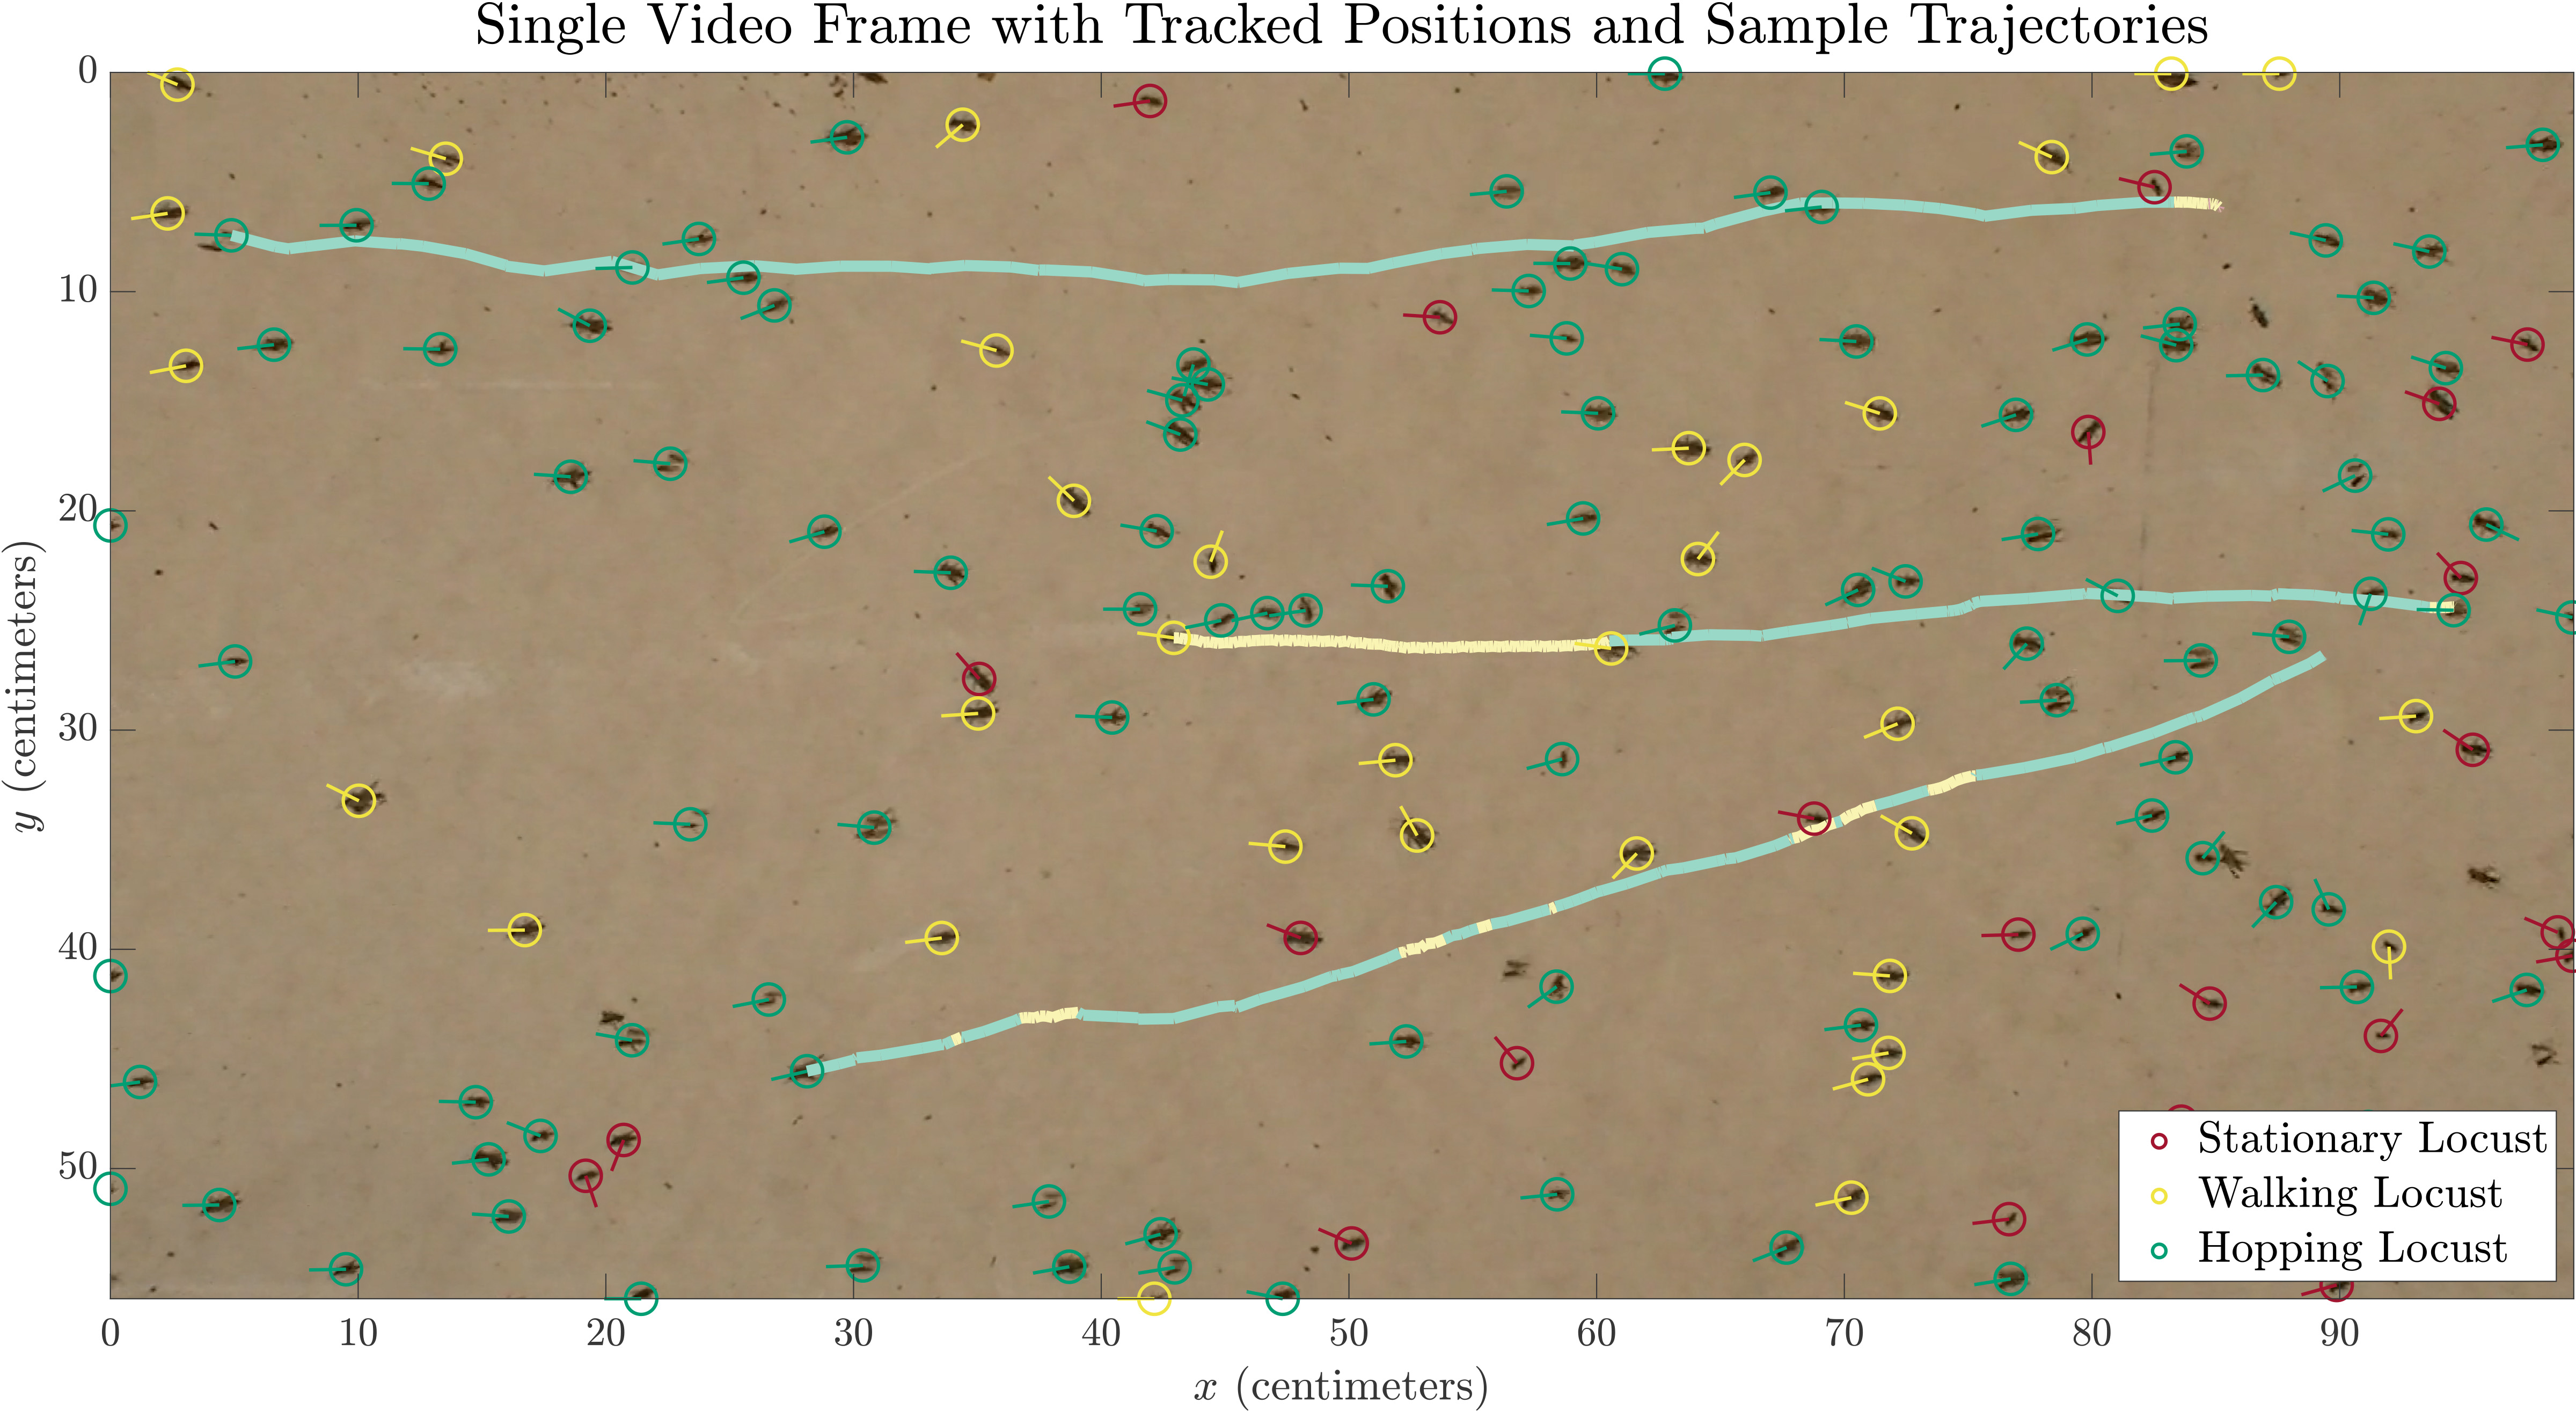
Figure 2. Short video clips show the original video data (top) and with extracted data superimposed (middle) where colors indicate stationary (red), crawling (yellow), and hopping (green) locusts. A still frame taken from the video shows sample trajectories (bottom) [3].
Using a Bayesian particle filter applied to these trajectories, we infer the parameters for each of the interaction models above that best fit the data. We simulate a swarm with each of these interaction models and find that only the simple averaging model reproduces collective alignment observed in the original video. For more details, look for our forthcoming manuscript [4].
Figure 3. One-minute videos showing original footage (top) and swarms simulated using the simple averaging model (middle) and the nearest neighbor model (bottom).
This suggests that locusts do, in fact, pay attention to more than one of their nearby neighbors at a time. Now all that’s left is to scale up the simulations, and we see some of the patterns of crop destruction emerging!
Figure 4. Long simulation of a cross-section of a swarm moving into a food source. Periodic boundary conditions emulate a larger swarm with insects entering this cross-sectional area from above and below.
References:
[1] D. Fisher and R. Williams, Curious link between swarming locusts and agriculture, Australian Broadcasting Corporation, Retrieved July 2025, URL: https://www.abc.net.au/listen/programs/scienceshow/curious-link-between-swarming-locusts-and-agriculture/5624398.
[2] W. Spratt, Risk management of a major agricultural pest in Australia - plague locusts, The Australian Journal of Emergency Management, 2004.
[3] J. Weinburd, J. Landsberg, A. Kravtsova, S. Lam, T. Sharma, S. Simpson, G. Sword, and J. Buhl, Anisotropic interaction and motion state of locusts in a hopper band, Proc. Roy. Soc. B, 2024, DOI: 10.1098/rspb.2023.2121.
[4] A. J. Bernoff, R. A. Everett, M. E. Hohn, J. Maclean, W. C. Strickland, and J. Weinburd, Selection of alignment models via Bayesian particle filtering of locust trajectory data, In preparation.
| Author Institutional Affiliation | University of St. Thomas |
| Author Email | |